You might be familiar with where it all started: the status board we put on our Panic office wall in 2010.
Since then, as you may know, we turned that status board into an iPad app called Status Board. Now everyone can have a cool, beautiful, data-packed status board on their desk or wall.
And since we built the app, we rebuilt our status board, making it twice as good! (Literally.)
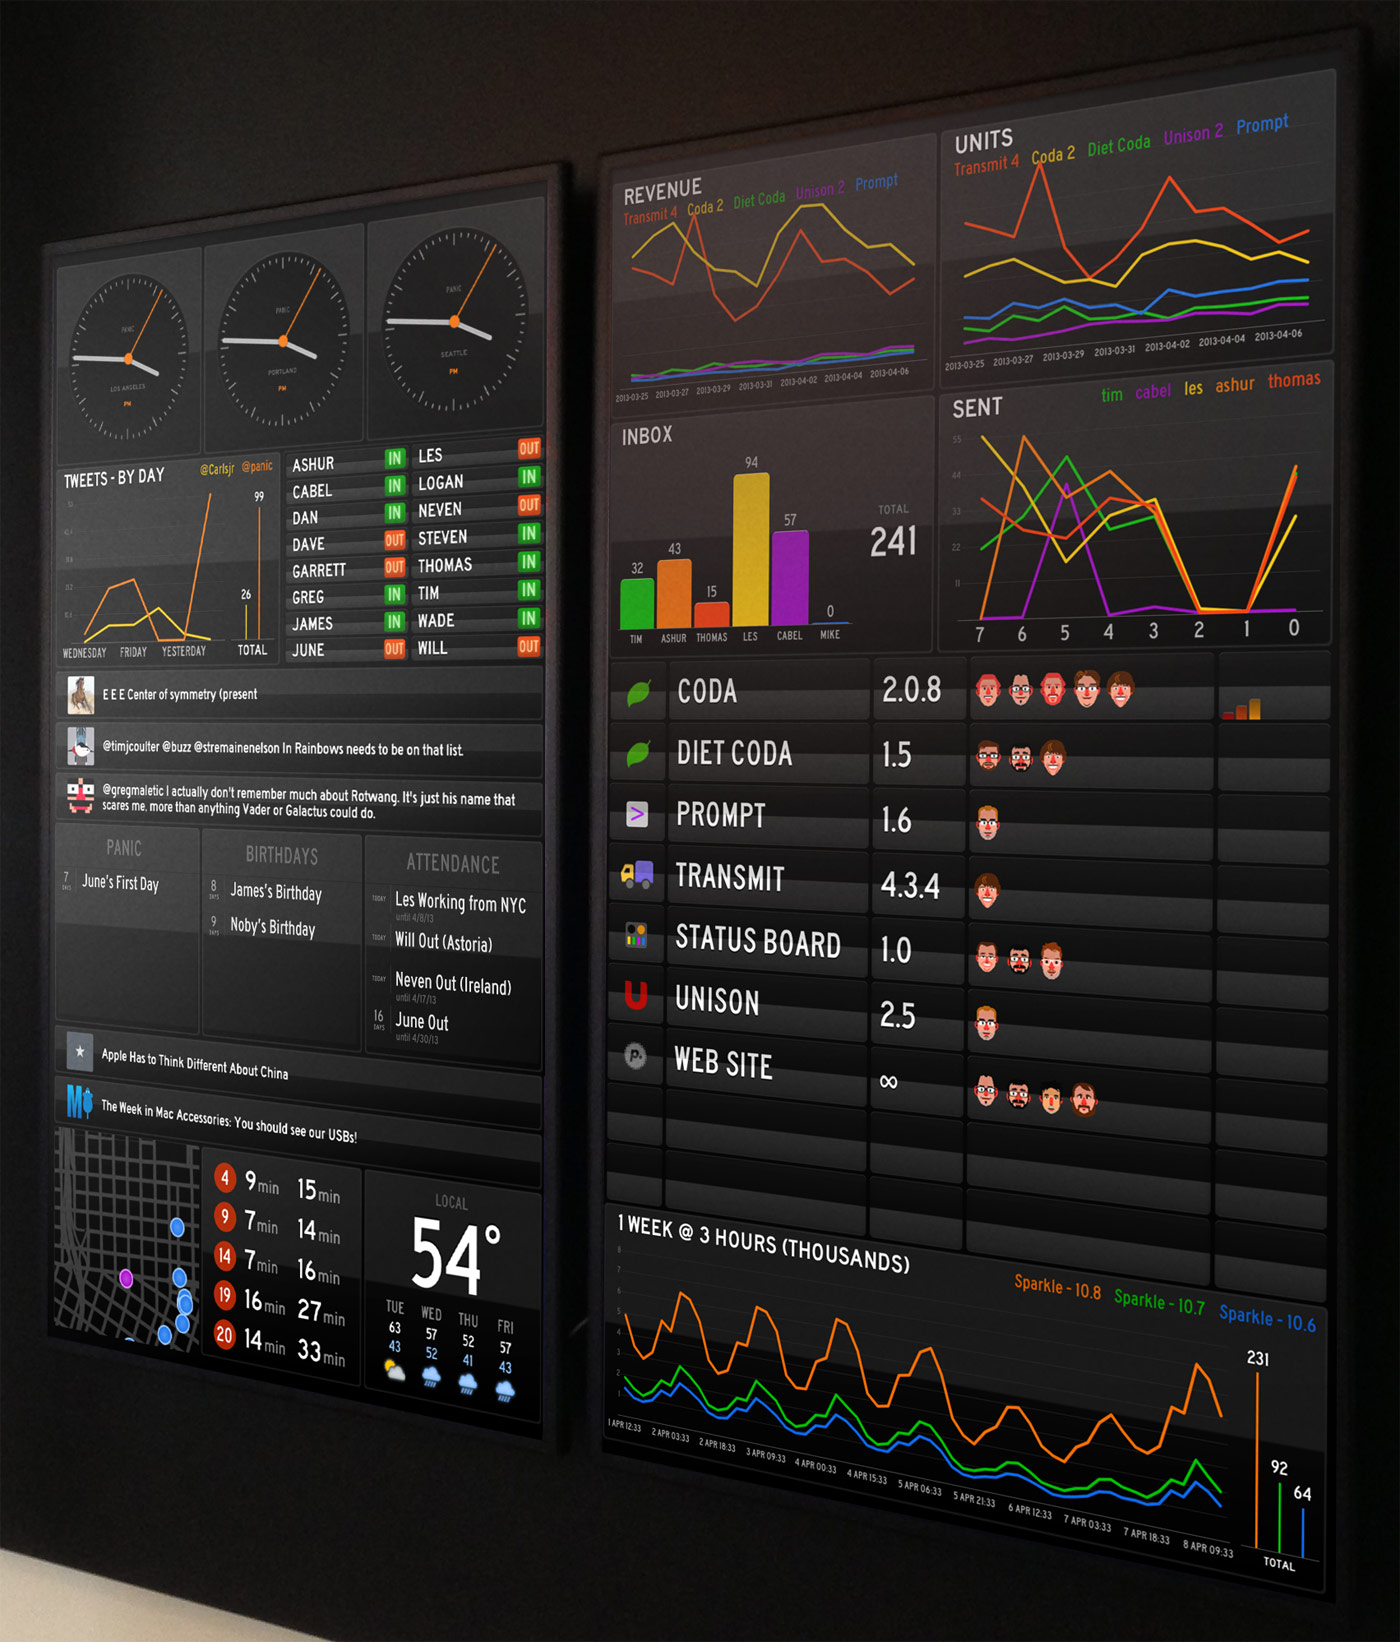
No, you’re not seeing double — this time we went with two goofy screens of stuff.
It’s pretty glorious.
About The Panels
Here are some implementation notes on our board:
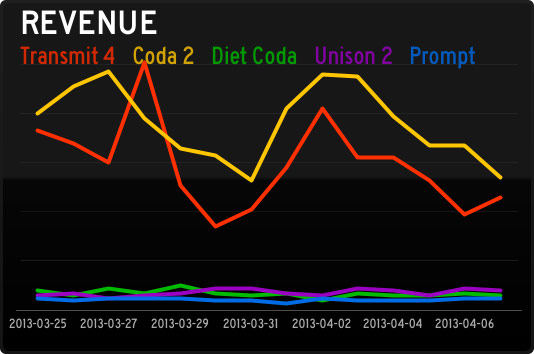 Traditionally Panic is quiet about how-are-we-doing data. It always feels like a possible distraction for our hard-working team. But we’re always changing, and this revenue Graph panel has been fascinating. Every day a script totals up our direct sales data, then retrieves our App Store sales data using AppFigures and their nice API. The totals get dumped into a database, and then we make that available via a simple PHP script that outputs JSON to the Status Board. That might sound tricky, but all told it took about a day of work to make happen.
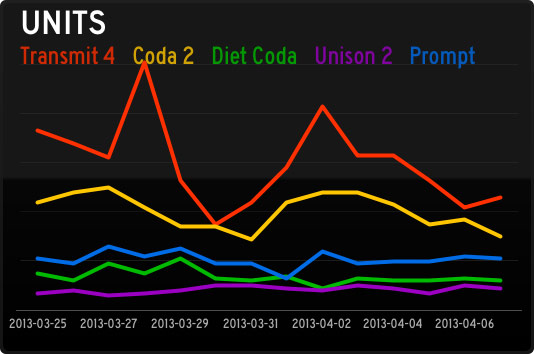 Units have been especially interesting since they reveal so much about the economics of (our) iOS software, as this Graph panel shows. Although (our) iOS apps sell a respectable number of units, the revenue they bring in barely charts compared to our Mac stalwarts. So far! We’re working hard on improving our iOS apps, and trying new ideas, in order to crack the iOS market a little bit more. (Sorry this chart was pre-Status Board, which is doing well!) By the way, Graph documentation is here.
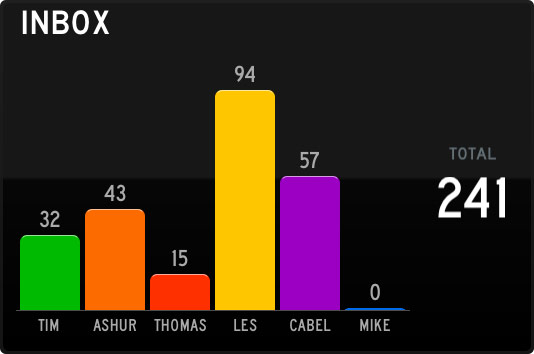 The Support team works tirelessly to fight this tide! This is just an Email panel, which ties into our IMAP server. It took about 3 minutes to set up, and has been incredibly useful to see what our support load is at a very quick glance. (On the server, each Support person shares a single “Help” IMAP account, which has folders for each support person, and a script distributes the incoming support requests round-robin style.)
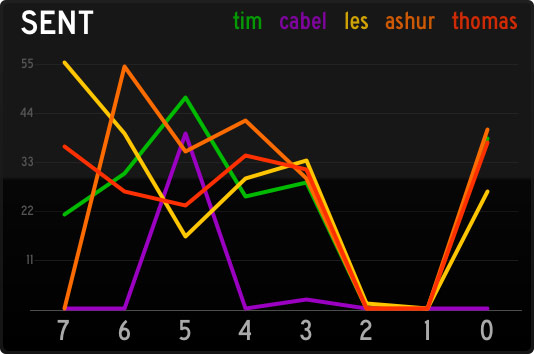 Conversely, this Graph panel this is a great way to quickly see how many support responses are going out the door. (Of course, it’s not a competition — it’s just for fun.) To get accurate Sent counts, we have a script that looks at both outgoing Twitter replies, and outgoing e-mails, and totals them up per-person into JSON.
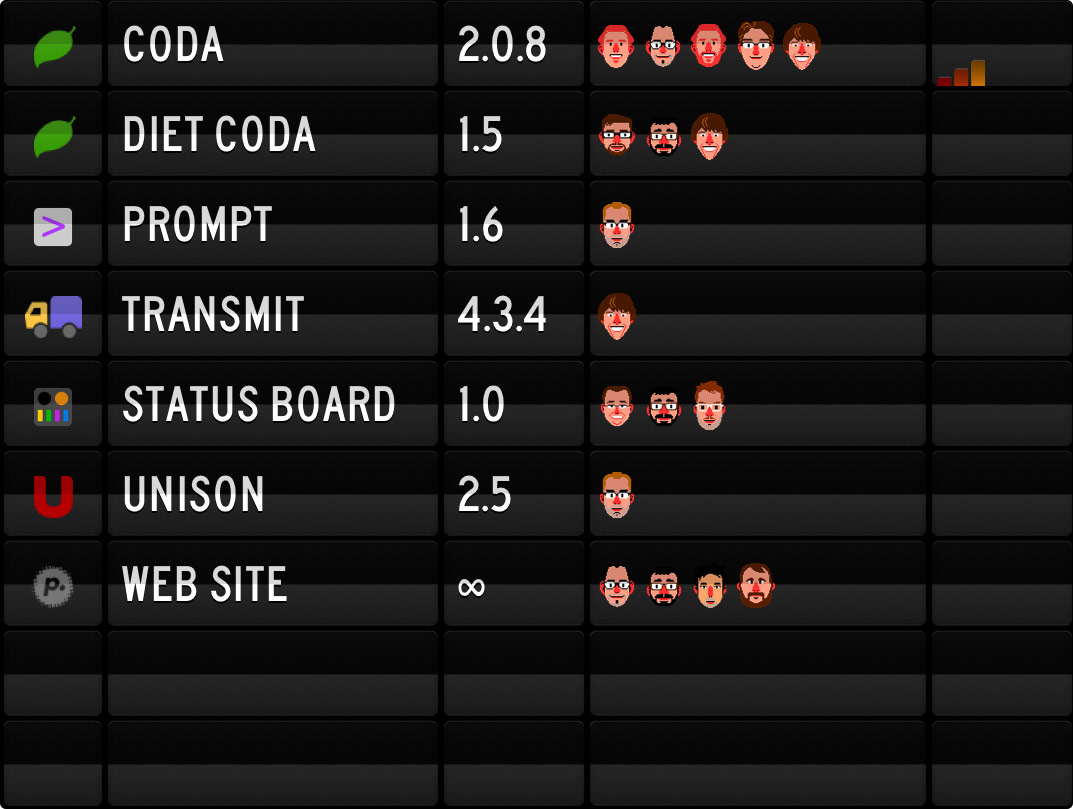 This list is using our Table panel, connecting to an HTML file on our server. (Table documentation is here.) This is an edited version to protect our secret projects, of course. A project list is always tricky, since it’s the most manually-updated thing on the board, and always runs the risk of being stale. But, it’s fun to see who’s working on what.
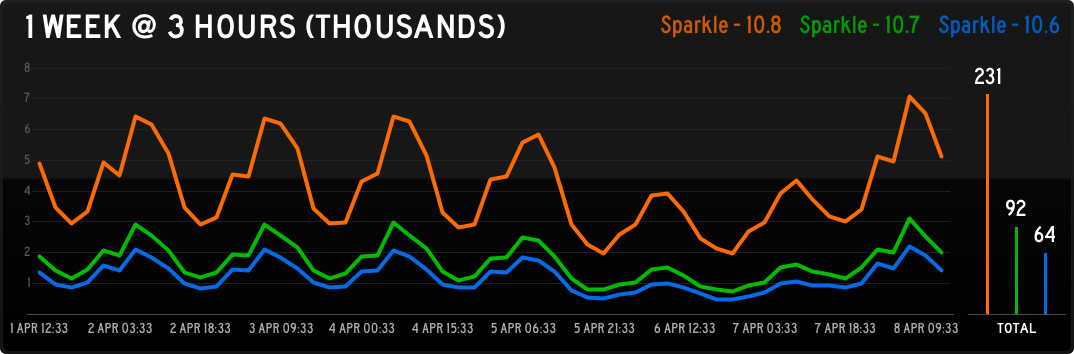
 This is our car2go map, so we can quickly see if there are any cars near the office that we can hijack and drive home at the end of the day. It’s totally custom — we’re using the Do-It-Yourself panel so it’s just a little web page on our server. We signed up for the car2go API and combined their data with Google maps and some nice CSS animation. If enough people are interested, we might make this available to others. (Does your city have car2go?)
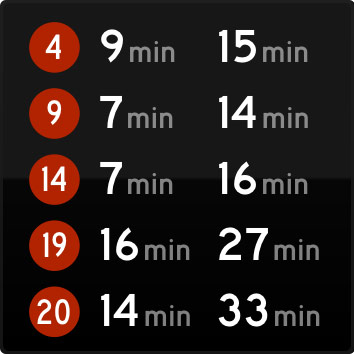 This is another Do-It-Yourself panel to show everyone’s bus lines. Sometimes end-of-the-day conversations are abruptly interrupted when we notice a bus is nearby. Logan has more recently made his own TriMet panel that we like a lot.
Hardware Notes
- This time, we chose the Samsung DE55A 55″ Professional Display. Bright, thin bezel, built to stay on.
- To cover up the Samsung logo, we used a piece of black non-glare artist tape. (Electrical tape was too shiny.)
- We installed a double gang outlet in the wall, to support 2 TV’s and 2 iPad chargers. Permanent power.
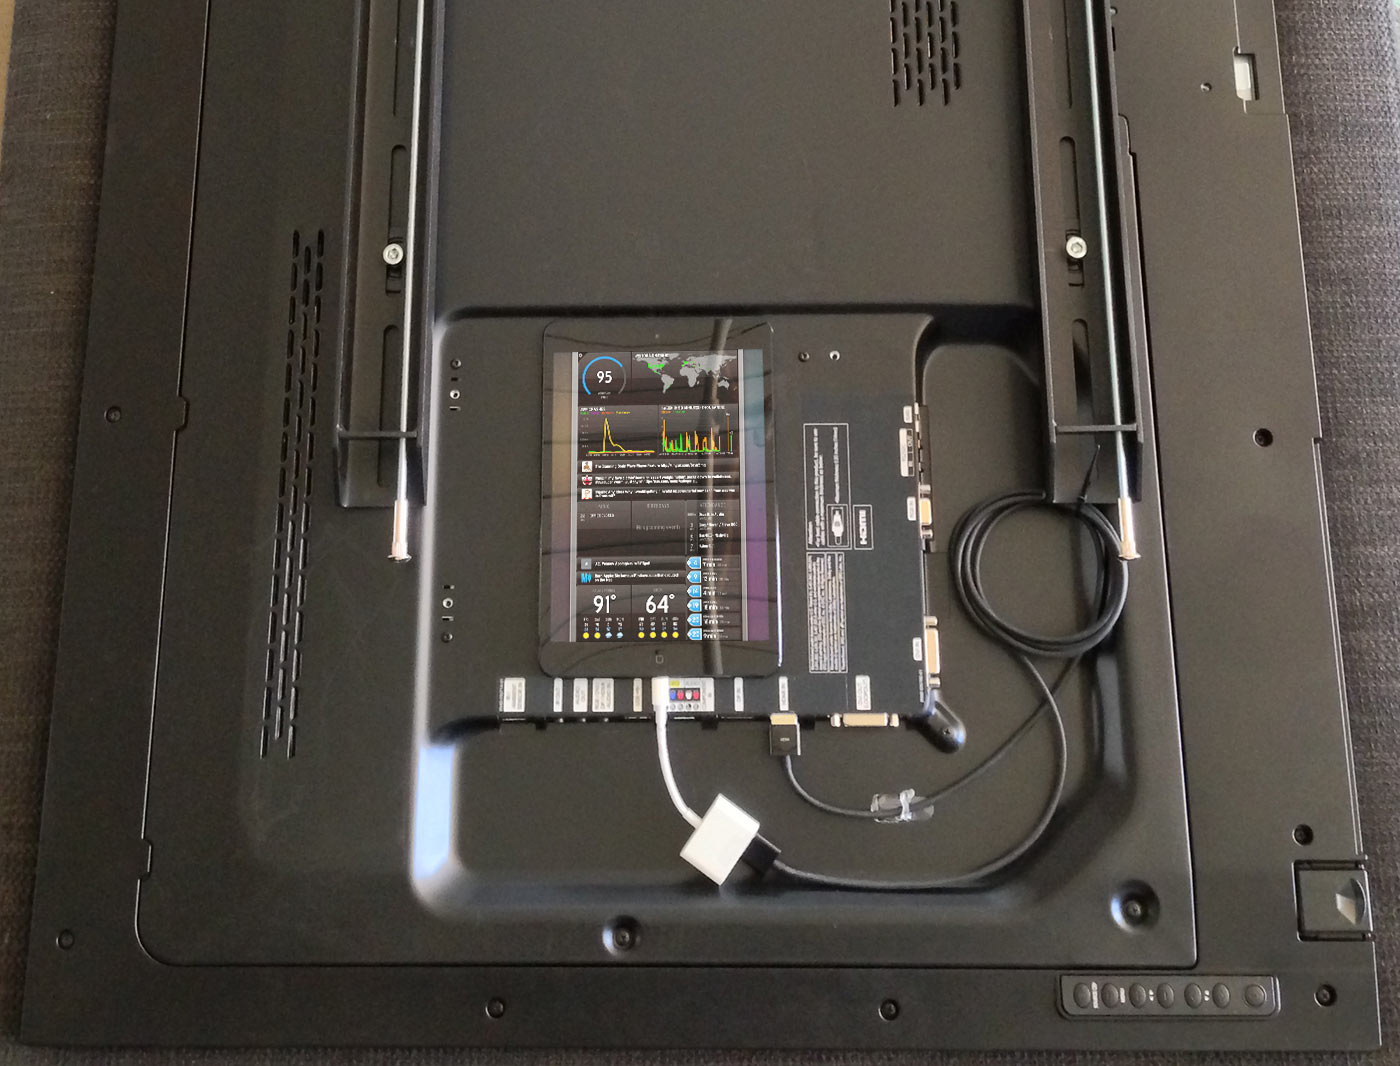
- We applied 3M Magnet Tape to the back of our iPads. They just stick right to the back of the display:
As people continue to build new things, our Status Board seems to change every week. Since taking these photos we’ve already added GoSquared, SNMP traffic graphs, and much more. That’s the best/worst thing about Status Board: it’s now so easy to make a cool Status Board that it’s hard to know when to stop. But hey, it’s fun!
If you’ve used Status Board to make a cool status board, send us a photo!
 Dustin
5/3/2013 12:17 PMYou guys need to mount the TV’s on rotating mounts. Rotate the TV, status board rotates. Would look hilarious :p
 Stan
Stan
5/3/2013 12:25 PMreasemble ipad and put ipad sensor to tv, and that’s it
 Sonburn
5/3/2013 12:30 PMMike is not pulling his weight on those support requests.
 Dave Kiss
5/3/2013 1:00 PMDo you guys have to recharge the iPad separately every few days? Any permanent solution?
 Jonathon
5/3/2013 1:07 PMTechnical question: Can Status Board compensate for the time warp that would be required for the Portland, Seattle, and San Francisco clocks to ever show different times? :P
 Phil Dokas
5/3/2013 1:13 PMHow do you deal with recharging the iPads? Unhook them at night to charge up for the next day?
 Molly
Molly
5/3/2013 1:25 PMCar2Go integration PLEASE! I thought it was a baked-in feature when I purchased StatusBoard, and was a little sad that I had to do it myself.
 Alex
Alex
5/3/2013 1:37 PMThose connectors that you see (the HDMI out Lightning connectors) also have a USB port on them, they probably just didn’t attach them when they took the TV’s off to take the picture because I’m sure they also have power cables for the TV as well ;D
 Phil Dokas
5/3/2013 1:50 PMAh, great point Alex, I see now that indeed, that’s this adapter: http://store.apple.com/us/product/MD826ZM/A/lightning-digital-av-adapter
And that has a Lightning passthrough port which could be plugged into the wall.
 Cabel
Cabel
5/3/2013 1:59 PMRegarding power: I updated the post to note we have a double-gang outlet behind the wall to accommodate constant power two TV’s and two iPads. (We originally installed a fancy USB outlet for the iPads but they couldn’t provide enough to charge two iPads at once.)
 Cabel
Cabel
5/3/2013 1:59 PMSonburn: Mike is no longer with the company.
 JP DeVries
5/3/2013 2:26 PMIt would be awesome if you made the car2go source available. Thanks!
 Derek
Derek
5/3/2013 2:28 PMThink that magnet tape would be suitable for slapping a Mac mini to the back of a TV?
 K. Mikey M.
5/3/2013 2:29 PMAlso, Mike is at Inbox Zero! LEAVE HIM ALONE!
 Michael
5/3/2013 2:44 PMThe fact that Horse_ebooks is on the status display for your company is downright awesome.
 Marc
Marc
5/3/2013 3:51 PMSecond the Car2Go Support! :-)
 Justin M.
5/3/2013 4:11 PMcar2go mappy thing would be awesome. I had a great time playing with custom map panels myself.
Also, these two made me LOL:
…show the current time in Portland, Seattle, and San Francisco. You know, for conference call scheduling.
To cover up the Samsung logo…
 Mau
Mau
5/3/2013 4:22 PMCar2go support world be great for those of us in Vancouver as well!
 Dre
Dre
5/3/2013 7:09 PMI would totally go for a Mac solution. Server side, display to a few Samsung displays via Apple TV’s. iPads just don’t work. What do you think? If you build it I shall buy =)
 Yohann Paris
5/4/2013 8:45 AMThis is marvellous and look so cool!
Please share the Car2Go widget, I will love to have this, as well as the Bus system.
I’m slowly using Status Board to have more and more data, and the boss love it!
 And
And
5/4/2013 1:38 PMFantastic! I just wish that video out wasn’t double the price of the app :(.
Still love you guys, though!
 Cem
Cem
5/5/2013 7:35 PMAwesome use of data. I do have a question about the revenue graph though. Wouldn’t a “total sales revenue so far” data point be more interesting than “revenue per day”? Or, if not more interesting, at least as interesting to track? Because sales per day will swing up and down based on a bunch of factors, but I imagine seeing how much total revenue each app has brought to the company will reveal your real stalwarts over time.
 Johnny
5/6/2013 2:50 AMCan someone please explain how the “tweets by hour” graph works? Is it the number of tweets I see in my account per hour? Because I’m definitely not tweeting that much per hour.
 Gavin
Gavin
5/6/2013 4:54 AMSeems a huge waste of money/resources to stickytape a whole iPad to the back of a TV.
Hopefully AppleTV supports apps and it can be run off that, or perhaps a browser-based solution that can be run off something like a Raspberry Pi.
 Michael
5/6/2013 2:35 PMWhen you have to make changes to the Status Board on one of the iPads, how do you get to it? Does the monitor swing out from the wall so that you can remove the iPad and make changes?
 Ben
Ben
5/13/2013 7:17 AMThanks for the info, was a good read :)
 stormgen
5/15/2013 11:13 AMAll of you are artists, both in design and creation.
 Stephen
5/16/2013 12:01 PMI’ve been completely hooked on StatusBoard… I’ve put together 4 panels so far for work use piping in data from our servers, help desk, and client actions on the site (always good to know at a glance: what in the world are our clients doing on our system?)
Looking forward to a “spaces” kind of function on a StatusBoard update so I can pipe in more data
 Roberto
5/18/2013 2:05 AMTrade markets like a Boss! …a little update to the service previously created http://goo.gl/E790q
 Josh
Josh
6/2/2013 9:08 AMWhat about burn in’s? On both the TV or iPad? I haven’t downloaded the app yet but is there any way to automate a full screen refresh? or perhaps have the boxes move around once every 5ish minutes to prevent a burn in?
 David P.
6/6/2013 11:35 AMI’m an industrial engineer and this is one of the apps in 2013 that has the greatest potential so far for my professional uses. There are many indicators that are interesting to implement in a plant and Status Board can do all the magic. Stay tuned.
 Marc
Marc
7/3/2013 5:18 AMcan’t wait for un update of the app with multiple board support, more chart graphics joices and the ability to save dashboards within the app ! keep up the great work but please release an update soon ! : )
 RA Vasquez
7/15/2013 10:23 AMWhat about the out of office widget? How does that work? Is is really realtime?
Thanks for the great app!
 Jan
Jan
7/18/2013 12:06 AMGreat update. And +1 for the car2go widget to be made available. If it is there, why not share it ;-)
 John
John
7/22/2013 12:16 PMIt’s pretty glorious. ;-)
 bill bulman
8/9/2013 8:51 AMCan anyone recommend 55″ tvs for this vertical status board usage? Can any tv be used as a monitor but turned vertically?
 David R.
8/9/2013 9:58 AMI love status board and have used it to create a metrics board for our online properties. The only problem is that i’m not a programmer so much of what the software can do is beyond my currentl skill level. It would be awesome if panic would allow in-app 3rd party widget downloads/purchases so you could find and add new modules to expand its capabilities. I would also love to see some expanded documentation on what can be done with excel and perhaps other web tools to create custom tools
 max
max
8/17/2013 3:03 AMThis web site is often a walk-through for all of the data you wanted relating to this and didn’t recognize who to question. Glimpse below, and you’ll certainly discover the idea.
 Romana Rubicon
9/29/2013 2:11 PMIs there any plan to make this a native app for OS X or something? I’d love to run this on a monitor and/or TV (maybe via AirPlay) but would prefer not to buy an iPad just for that purpose.
 Lance
Lance
9/30/2013 7:06 AMI am curious as well if there are any plans to create a native OSX version of the Status Board? I’d love to have it lingering on one of my monitors!
 Dale
Dale
9/30/2013 4:22 PMThe latest version was updated “at Apple’s request” to not include live updates when you are in edit mode. What’s that all about? Now you have to keep switching back and forth to see which panel you are actually changing.
 Jonathan
10/9/2013 12:22 AMThis looks like exactly what I need for the garage I do computer work for. Would be nice if they could run it off one of the existing Macs instead of them needing an iPad. Any plans for this? Be really great if Apple would allow apps on the Apple TV’s and then this made native for it. Keep up the great work anyhow. Love Panic and their software.
 Paul Imboden
10/23/2013 7:56 PMSeriously, a native OSX version becomes an instant-buy…
 Wil Ferrel
12/22/2013 8:49 PMYep +1 to Mac OSX version.. but in the meantime I created a Open Source service to get JIRA and App Annie stats in order to use it with Panic Status Board check it out and contribute.. This is an awesome App and the more services the more people will customize and use it. https://github.com/wilferrel/AGAStatusBoard
 Kat
Kat
2/21/2014 5:42 PMDid anyone ever create a Car2go widget? I would love one in seattle.
 John W
11/23/2015 10:21 AM+1 on the Car2Go widget that’d be awesome!
 Ryan Collins
12/4/2015 10:44 AMWhat about an iPhone/iPod Touch version?
 Amod Sathe
1/6/2016 1:47 AMDo you have version for Android devices aswell, We would like to use this for our clients.
 Derek
Derek
1/23/2016 8:37 AMPLEASE PLEASE PLEASE, an Apple TV 4 app that runs as a screensaver would be the best thing ever.
 marc
marc
1/25/2016 6:53 AMIs it possible to use with an Apple TV with airplay mirroring?
 Matt
Matt
1/29/2016 7:35 AMAre you planning an Apple TV 4 app? Would be AWESOME if you are going to do this!!!
 Michael
2/4/2016 6:59 AMApple TV 4 App purchased the instant it’s released.
 Sasmito Adibowo
2/10/2016 5:26 AMStill no iPod touch support? Sticking an iPad *on the back* of the screen is a poor use of the screen. It’s better to use iPod touch or Apple TV ;-)
 robbog
7/13/2016 6:33 AMApple TV 4 app ?
Thanks!
 Spencer
7/28/2016 3:00 AMApple TV 4 App purchased the instant it’s released.
YES! PLEASE MAKE IT AN APPLE TV APP! Can I throw money at you now?
 Svend
Svend
8/30/2016 7:56 AMSecond the Apple TV 4 App. It would be a match made in heaven :-D